
Fero Insights is part of a new set of AI-enabled data and reporting tools built into the Fero platform, bringing business performance into one live view. We will be covering a host of the tools here over the coming weeks. First up are the sales and budgeting tools: where Fero clients can better understand 2026 performance across SKUs, customers and channels, set targets for 2027 and track progress against them as the year runs. No spreadsheets – just live, up-to-date and customisable data for Fero clients, so they can make better business desicions.
As the year draws to a close, most drinks brands are doing two things at once: working out how 2026 really went and setting the numbers for 2027. Usually that means exporting reports, rebuilding spreadsheets and reconciling figures from several systems before a single decision gets made.
Fero Insights changes that. With orders, stock and settlements that have moved through the Fero platform, the data is already there. The 'Sales' dashboard and budgeting tools let clients see it, plan with it and track it all in one place, with an AI assistant to boot.
A budget AI assistant, built in
The quickest way into Fero Insights is to simply ask.
With the 'Budget' tool in Fero Insights, businesses can build revenue and expense budgets by month and by channel directly in the platform. If clients have already built their own forecast, they can upload it instead. Either way, targets sit right next to live sales data. And the AI assistant is on hand to help Fero clients understand the gaps in performance. How is the budget tracking against actuals so far? Which channels are furthest behind, and in which months? Where is spending running over? What would a 10% uplift in the on-trade mean for the rest of the year? Answers come back in seconds, not hours spent re-running a model on a spreadsheet.
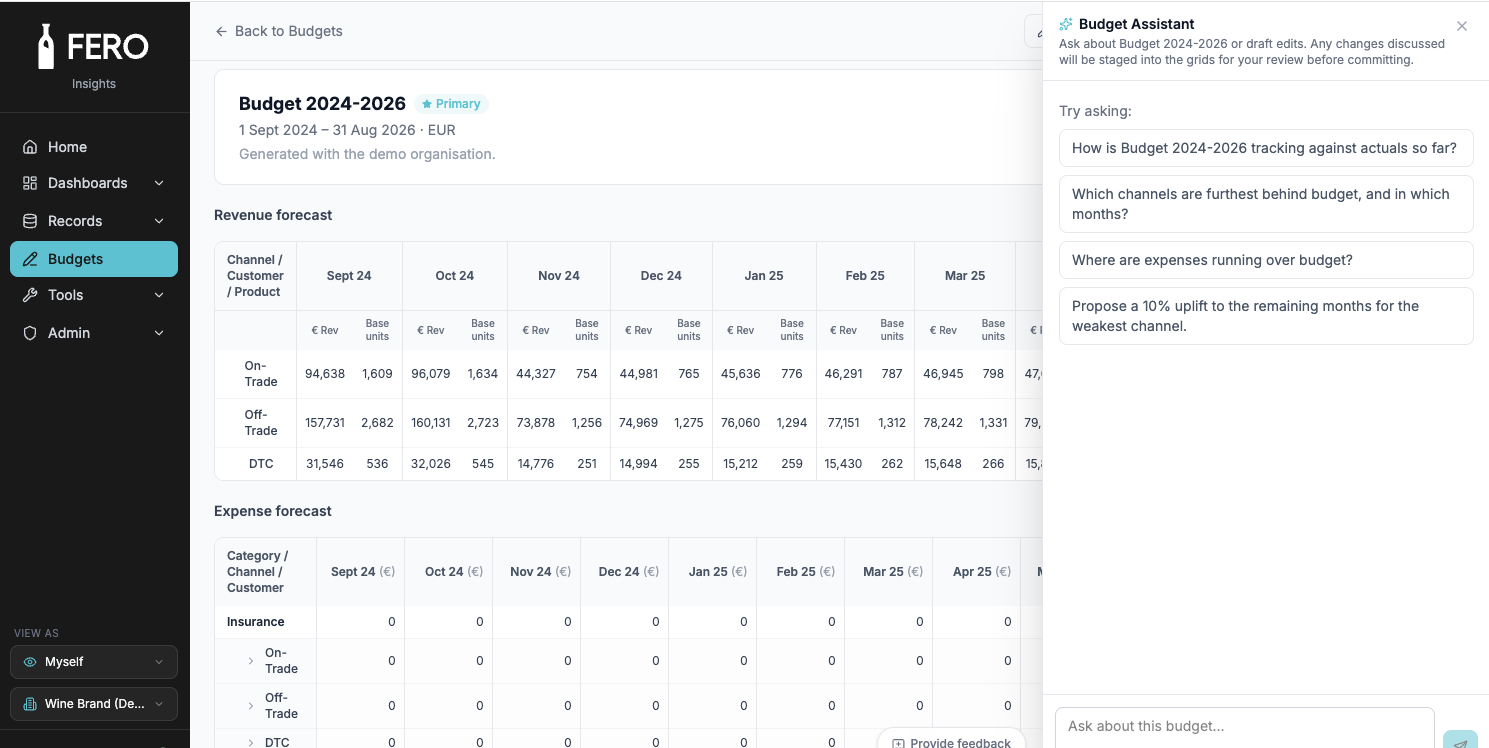
For most clients, the assistant will be the first stop for checking performance. For a deeper dive, more than 40 pre-built dashboards sit behind it.
Here’s a look at just a of them.
The year at a glance
The 'Sales' dashboard opens with the headline numbers for the year to date: total revenue, total base units, orders invoiced and average order value. Below that, sales over time are broken down month by month and coloured by customer, so clients can see at a glance who drove each month's volume.

This year against last year
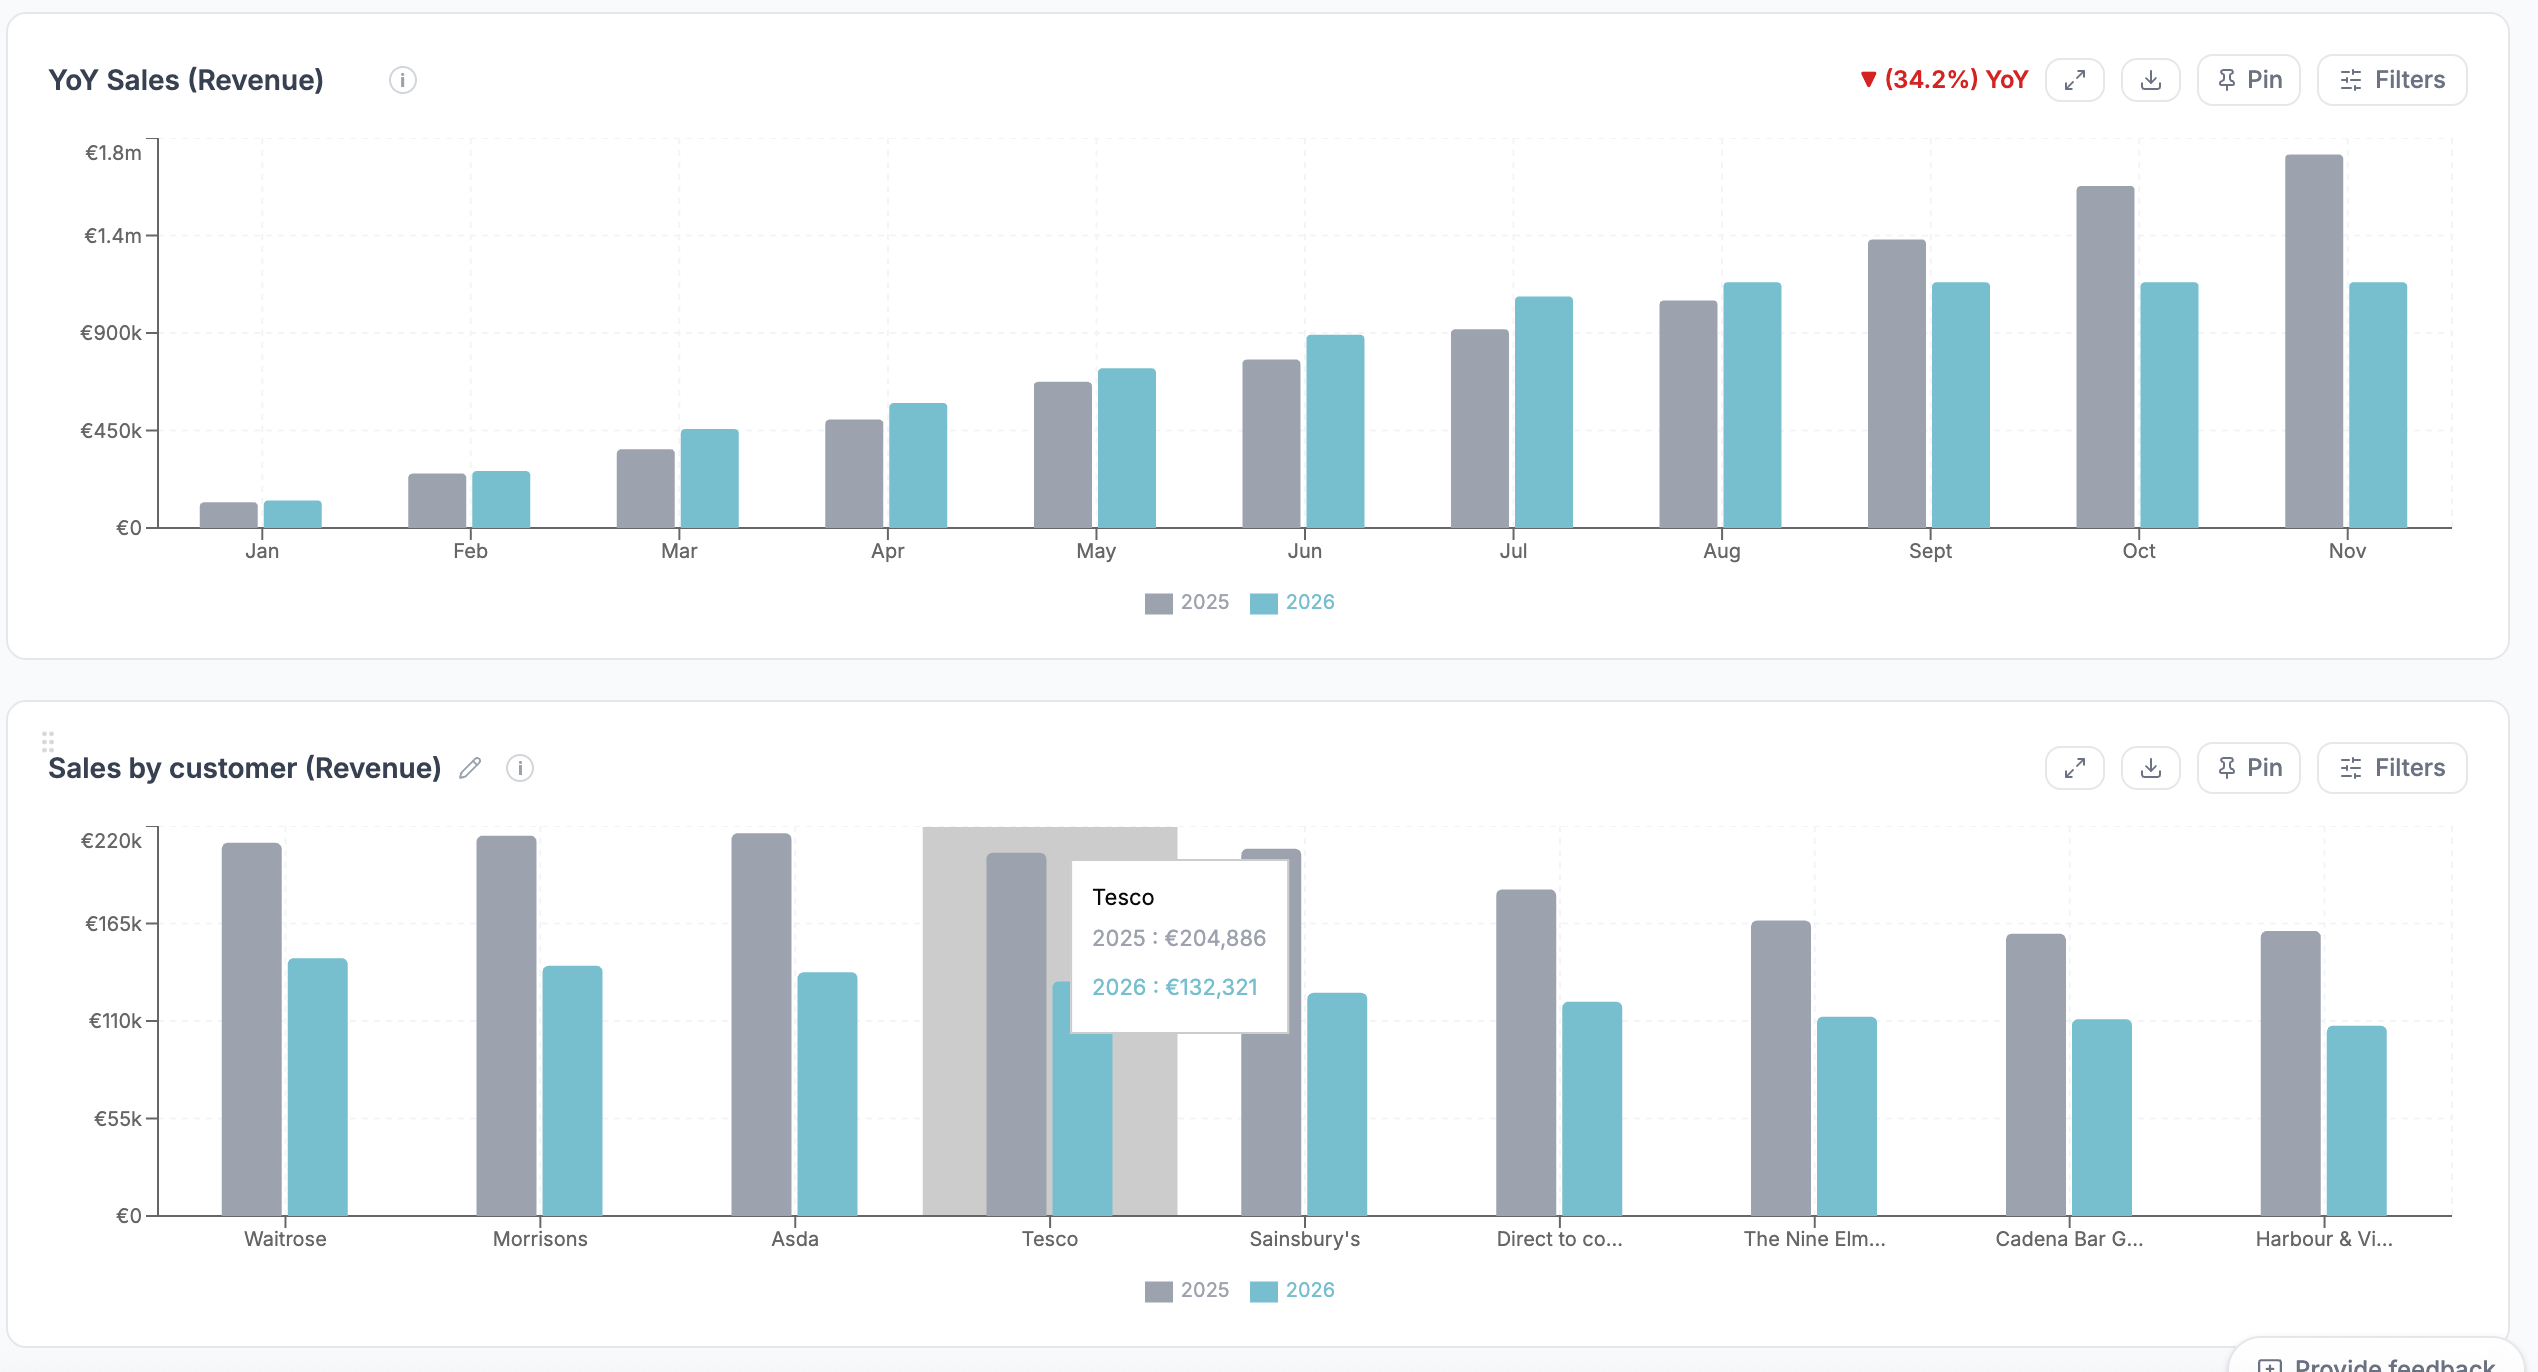
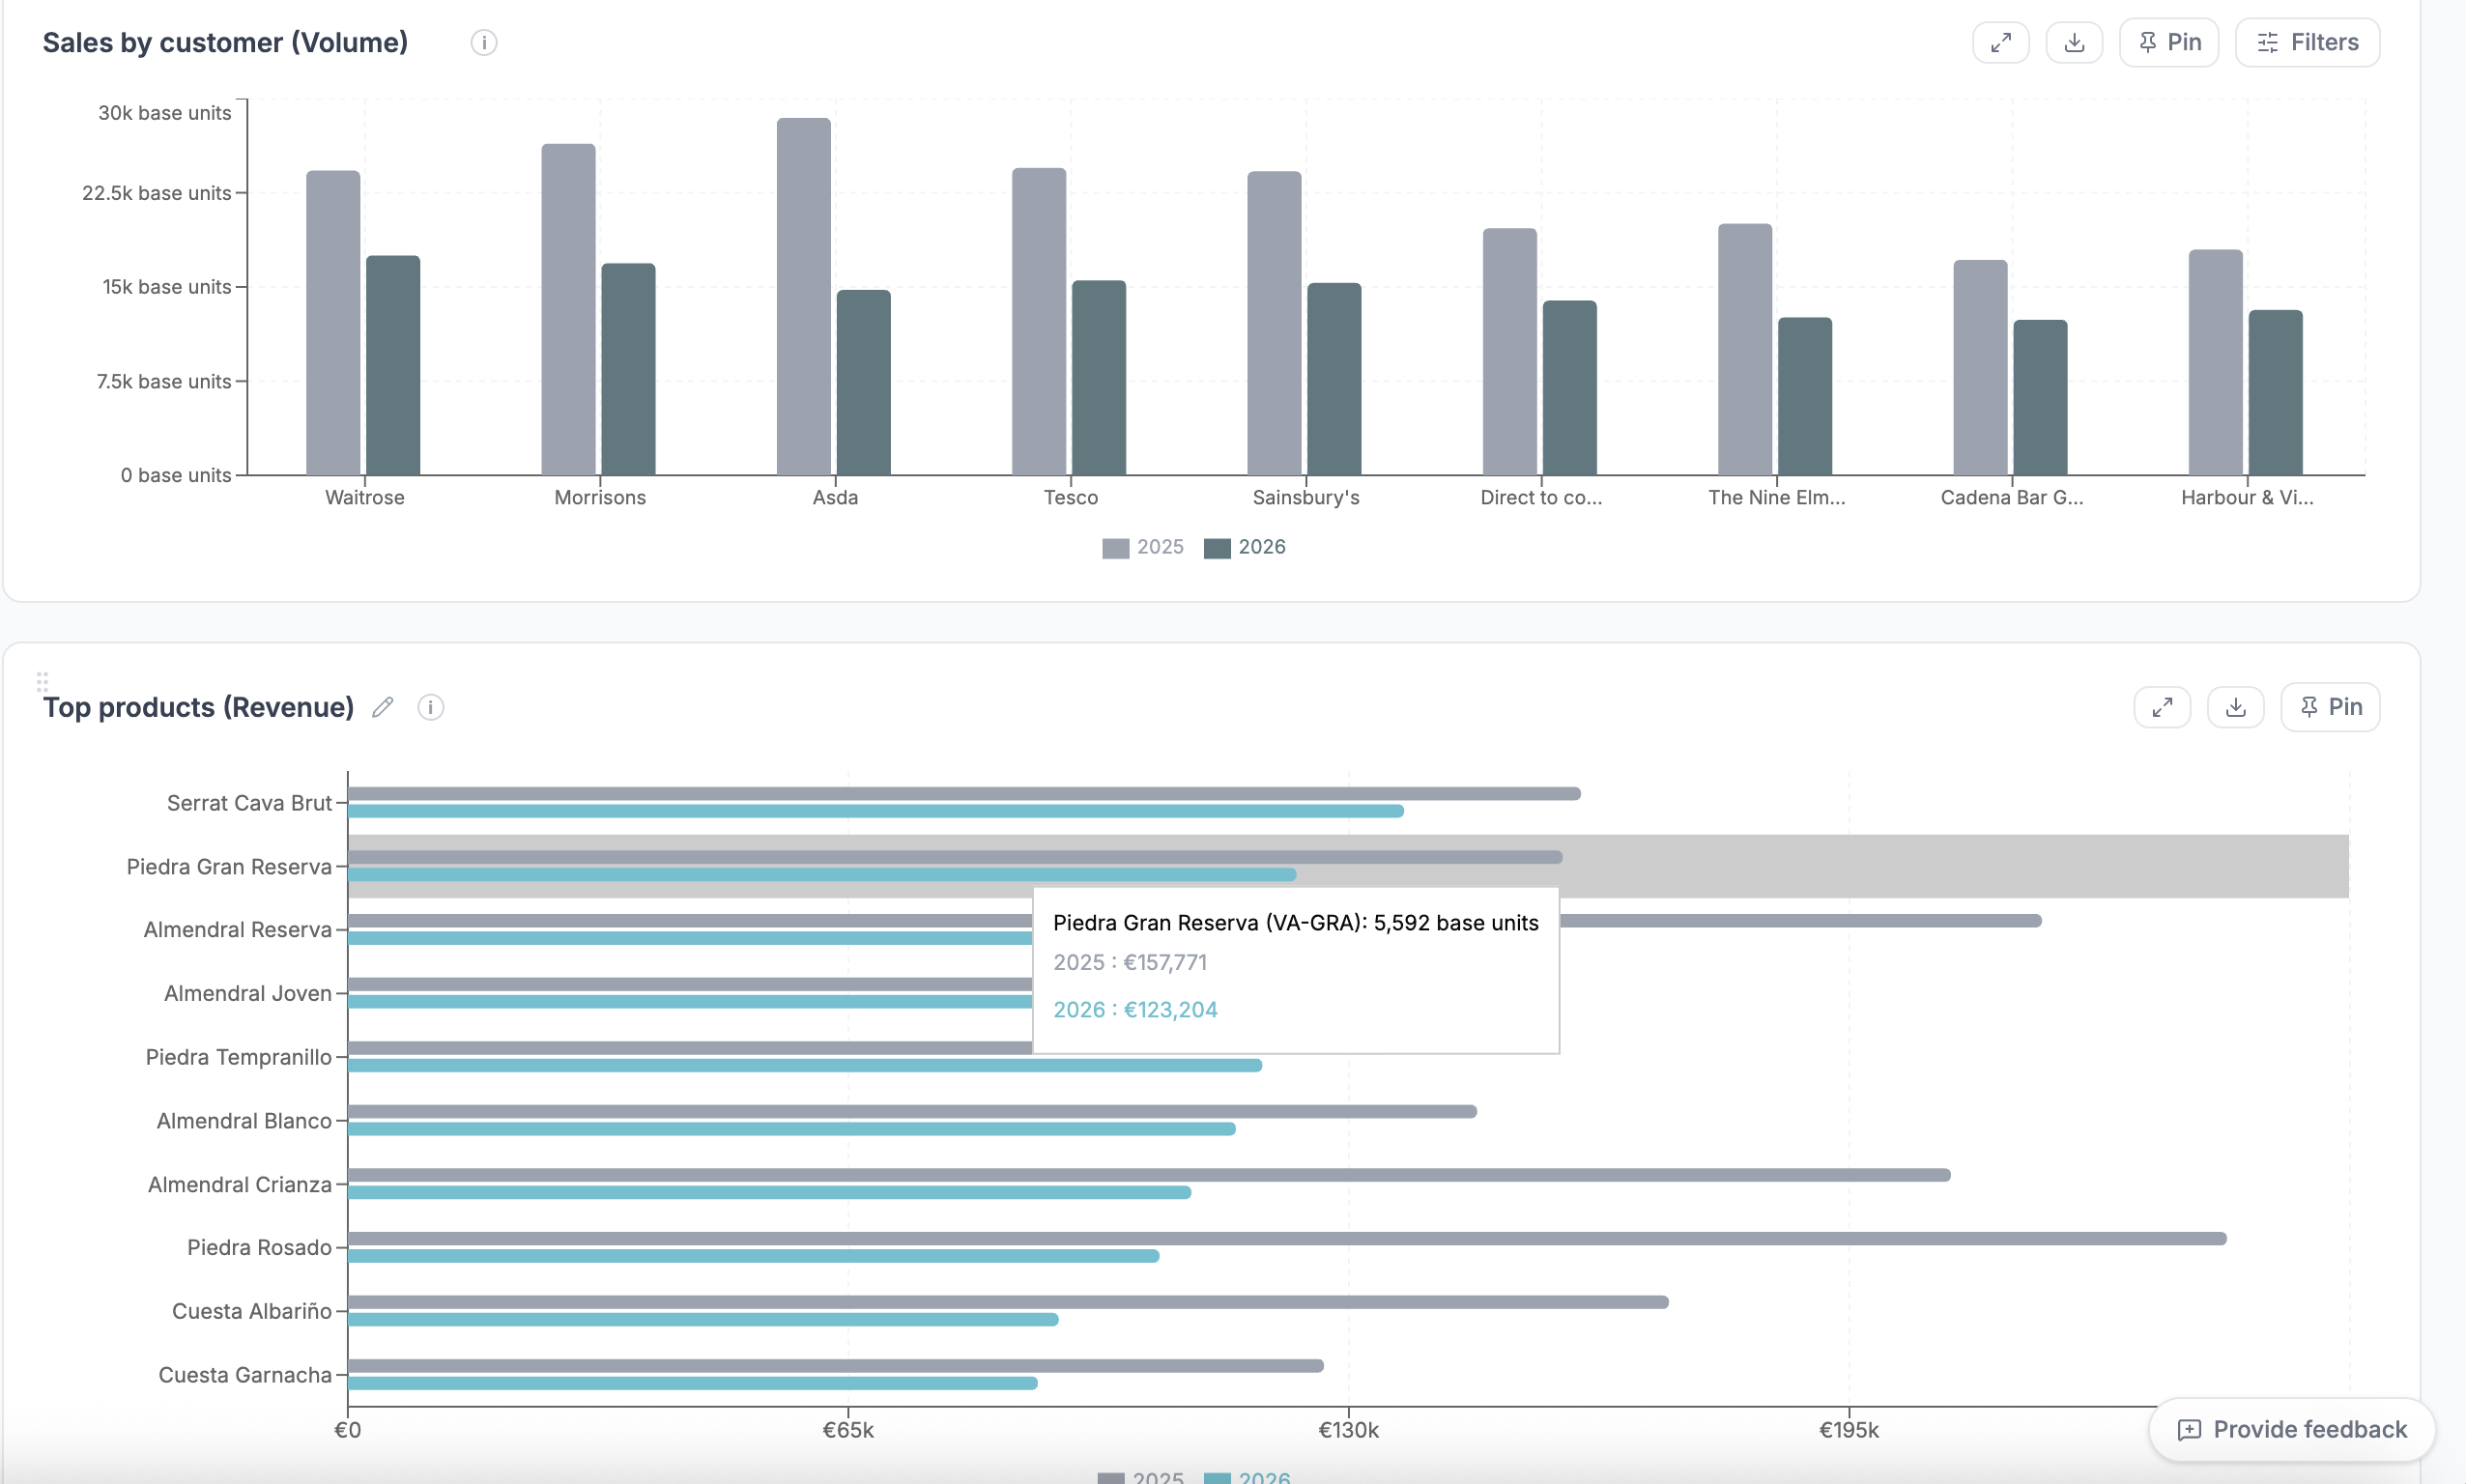
Every view that matters comes with a year-on-year comparison. Year-on-year sales tracks cumulative revenue against the same point last year, with the percentage change shown up front. Sales by customer, in both revenue and volume, shows which accounts are growing and which are slipping, retailer by retailer and channel by channel.
That makes the year-end questions easy to answer. Which customers carried the year? Where has volume fallen away? Is a dip in revenue a pricing story or a volume story?
What's selling, and at what price
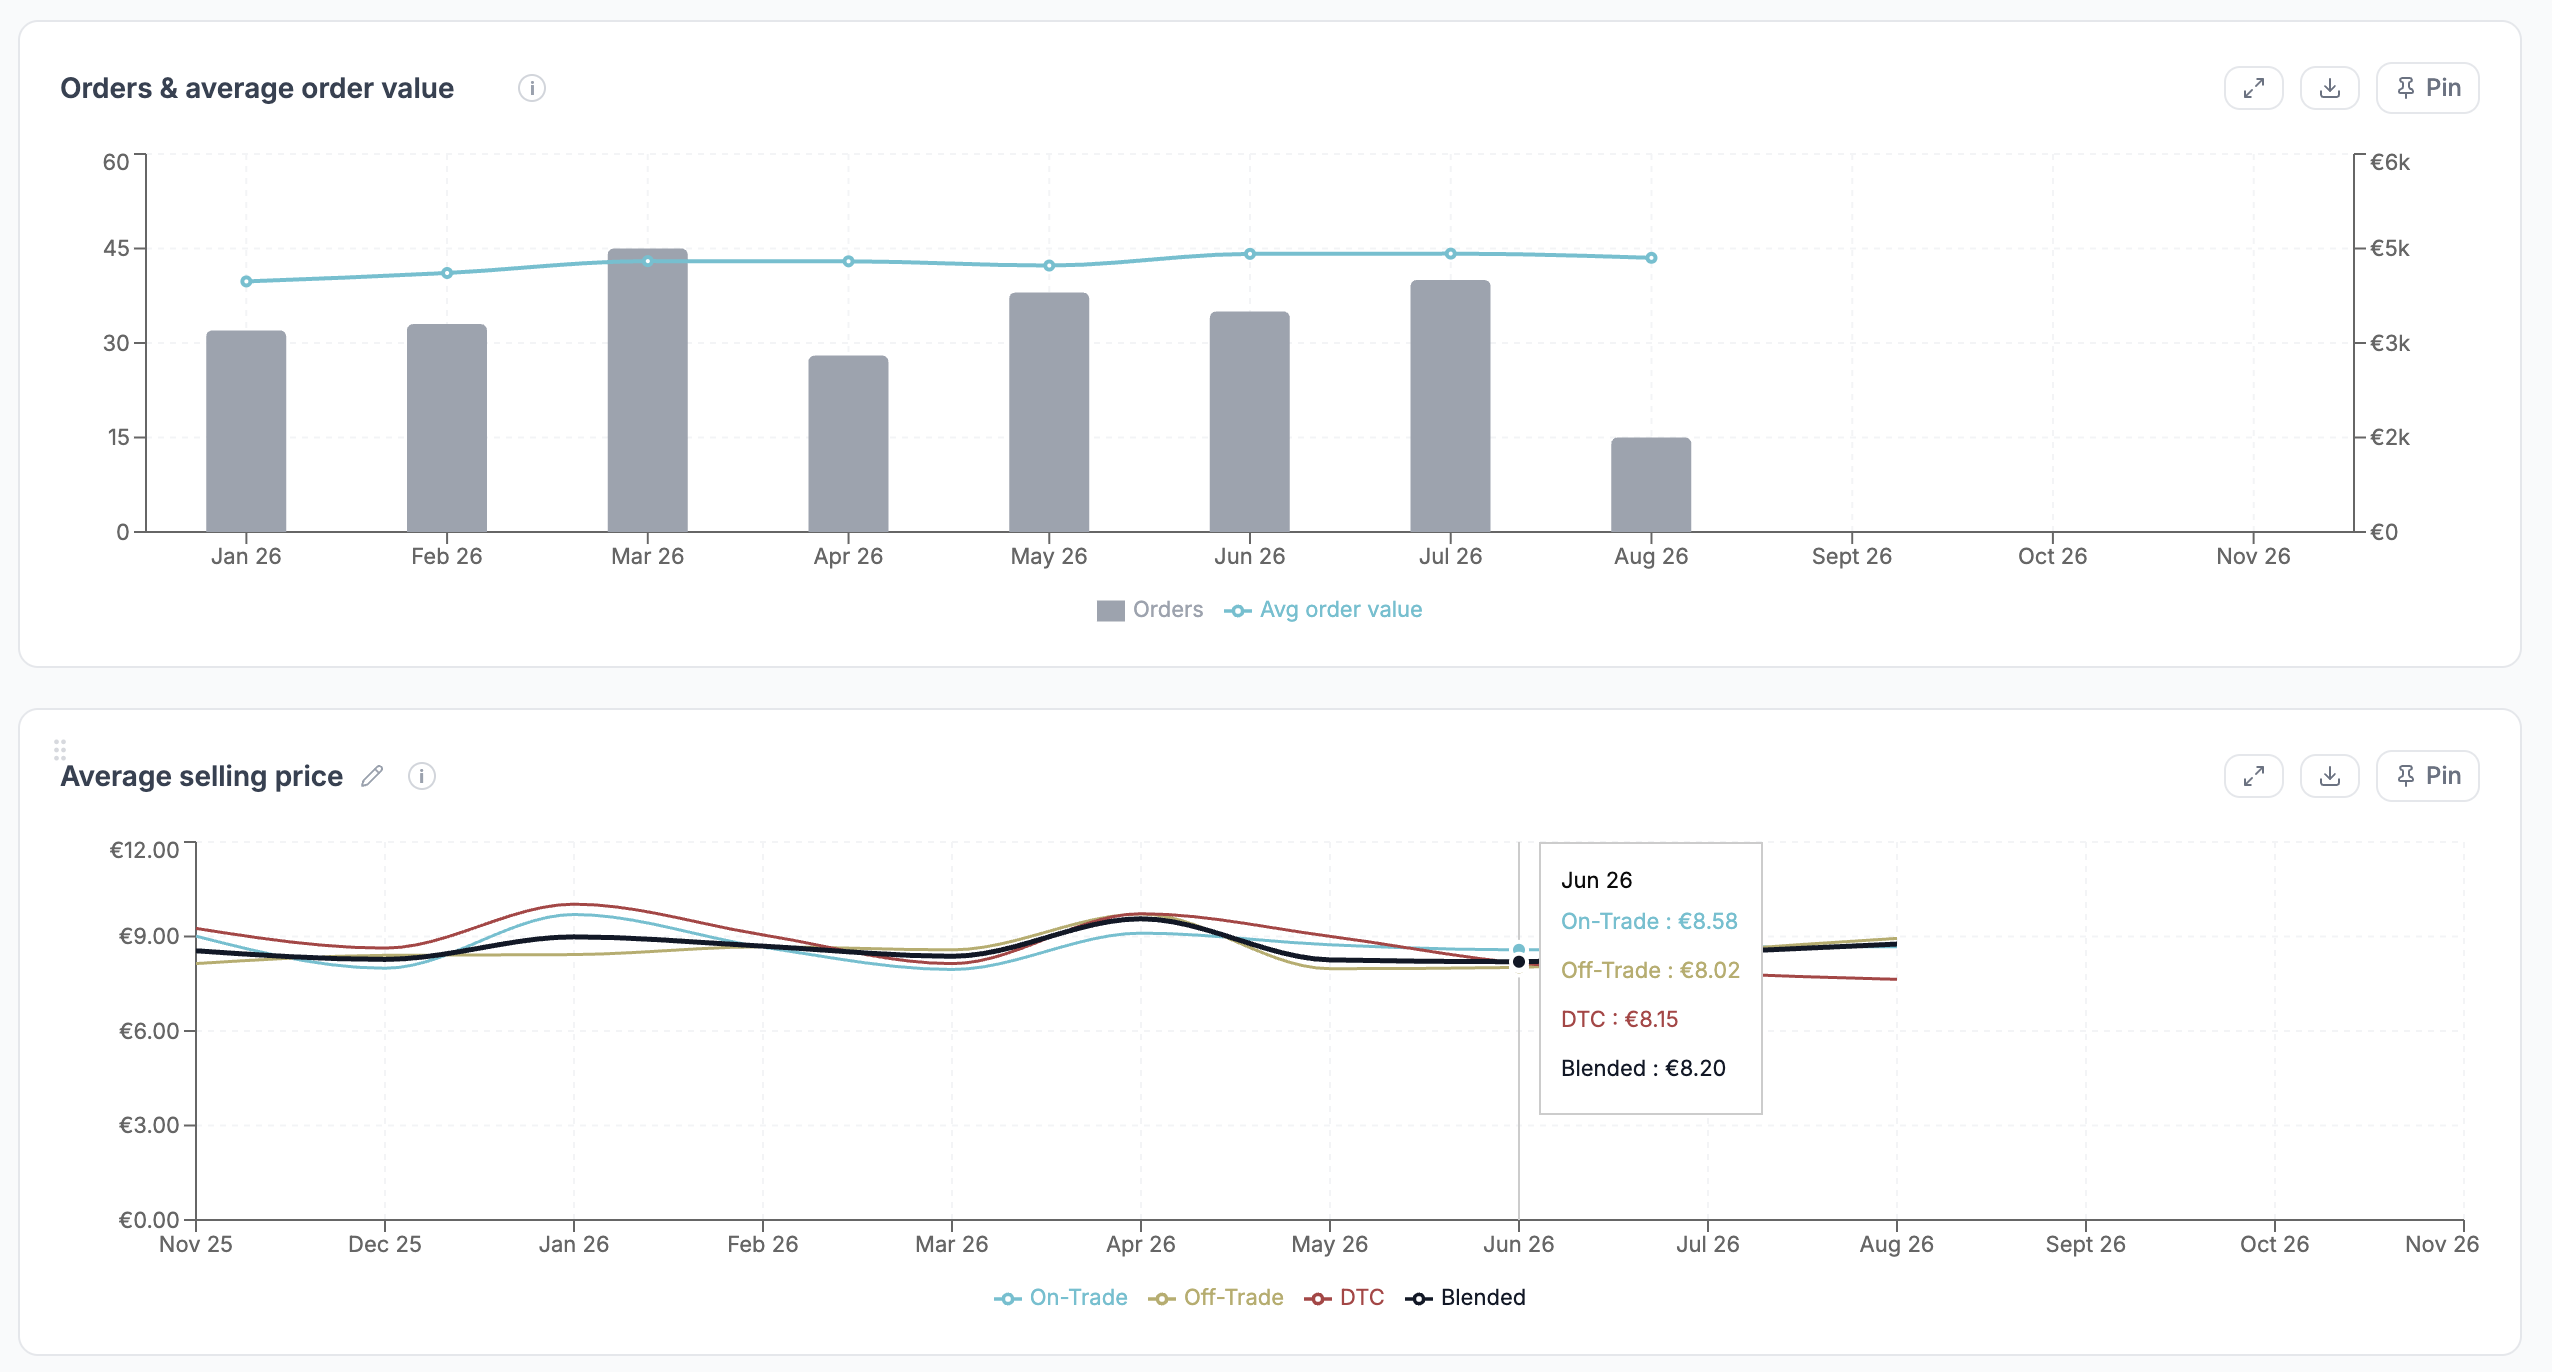
Top products ranks SKUs by revenue against last year, so clients can see which lines are earning their place in the range. 'Orders' and 'average order value' plots order counts against order size each month, and 'average selling price' tracks price by on-trade, off-trade and DTC, alongside a blended figure. Margin pressure or a shift in channel mix shows up here long before it shows up in the year-end accounts.
Looking forward, not just back
Historic reporting only gets a business so far. The 'Open order book' report shows committed revenue and open orders, which is the business that has already been won but not yet delivered. It's the first step a business needs to go from asking how it did, to answering where it is heading.

Setting and tracking 2027 targets
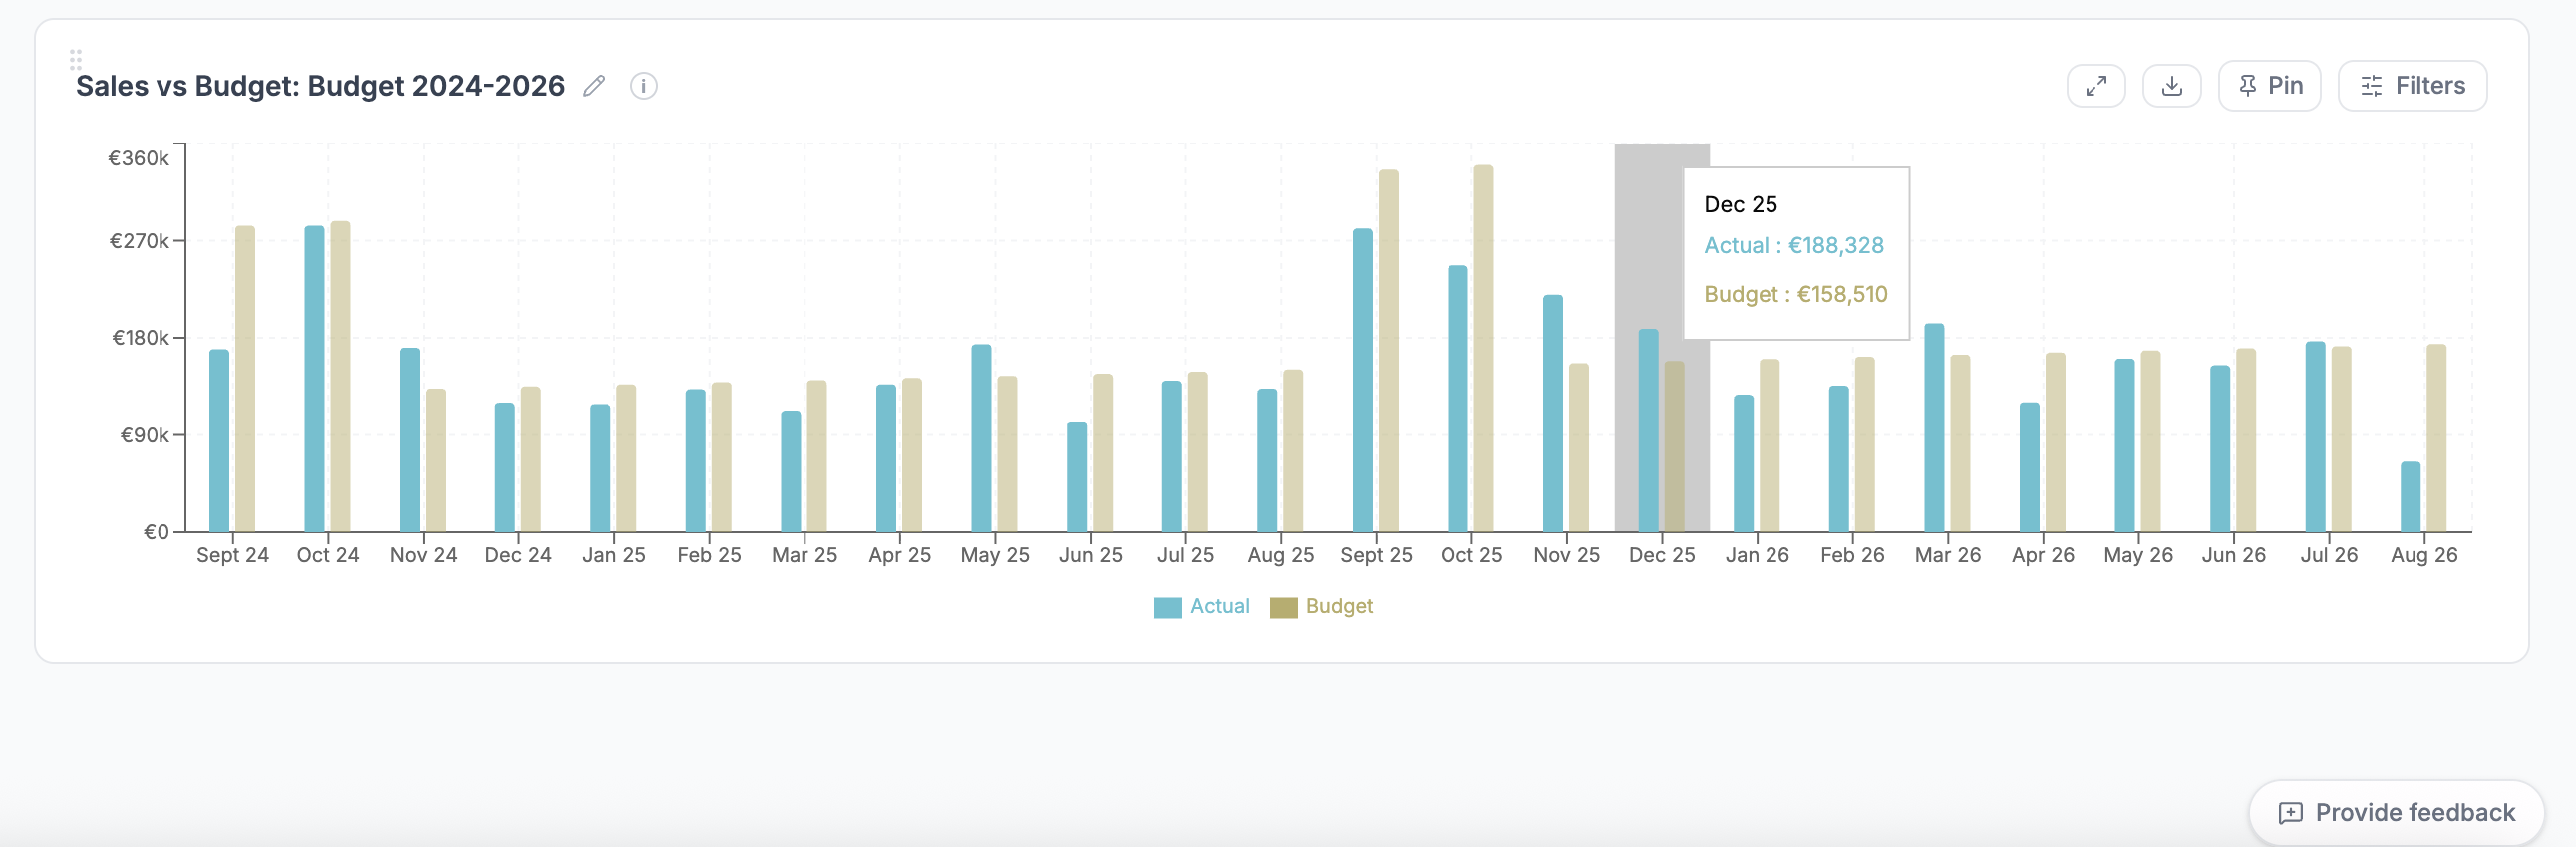
'Budget pacing' shows how much of the period has elapsed, how much of the budget has been attained, and whether a business is ahead or behind, in both percentage and cash terms, against a cumulative budget line. The 'Sales vs budget' tool breaks it down month by month, so business leaders can see exactly where a gap may have opened up.
That means a shortfall can be spotted in-month, while there's still time to act, not at the quarterly review.
Less time building reports, more time using them
Every report is pre-built, with 40 dashboards ready from day one and are being added to all the time, but none of them is fixed. Filter by customer, channel, product or period, with the ability to pin the charts checked most, save a preferred set-up as a view and download any chart's data when it is needed or when the month-end work has started.
The questions normally answered in a spreadsheet are now answered in the platform, and when it's time to report upwards, a board or investor pack takes minutes rather than days to build.
Why it matters now
The end of the year is when the plan for the next one gets made. With 2026 performance and 2027 targets in one live view, Fero clients can go into January knowing where they stand, and they can check again every month without repeatedly having to rebuild a spreadsheet.
Get access to Fero Insights
Fero Insights is available to Fero clients now. If you would like to review your 2026 performance and set up your 2027 budget be sure and connect with your Customer Success manager.
We will be hosting a webinar on 8 December 2026 to show off what these new tools can do! Register here to check out how you could be using these tools now.
Not yet a client? Be sure to book a call if you are interested in finding out how the Fero operating model could help support your business.
